
Ether mining profitability calculator
-
date_range 12/07/2017 10:30 info
Introduction
A long time ago I purchased a Butterfly Labs rig to mine Bitcoin. During that time I lived in a student house for which the rent included energy costs. This seemed like a perfect deal and a quick calculation showed that I would earn my investment back in just a matter of weeks. However, at that point the difficulty started to increase significantly and each day that passed shifted my break even date with two days. For this you do not need to be an economist to see that the break even date would never come. So after a while I decided to sell the mining rig and just invest it in bitcoin.
You will probably think, why is this guy talking about bitcoin while the title clearly states ether, well that is because of the following: since a few months ether is on a daily bases in the news. Some articles are about the recent price increase or about the opportunities and risks and even some about mining. And the articles about mining and cloud mining triggered me to build a reliable ether mining profitability calculator. As with the bitcoin story there are mining profitability calculators available, however these work with fixed or simple difficulty values. And with the current growth in net hash rate basically all these profitability calculators provide a too rosy image. That is why I build a profitability calculator which, based on the predicted net hash rate and daily ether to miner rewards, provides a realistic view of your investment returns.
This post describes the steps I took to create the calculator and how you can use it.
Data collection and preparation
Source data collection To be able to predict the net hash rate and daily ether to miners I needed data. I ran a quick search on google but could not find a recent full dump of the ether chain, which made me decide to collect it myself. To do this I downloaded geth and started the ether chain synchronization process. It took a while to get the 4M+ blocks but once I had them I could start the data collection. With the command below I started a local instance of the rpc client which enabled me to very quickly communicate with the chain. I used R to retrieve the block data from the chain and saved it to sql with R as well.
geth --rpc --rpccorsdomain localhostNet hash rate
The net hash rate is the total hash rate of the network. A prediction of this value is important because the percentage of your attribution determines the number of ethers you get in a specific period. The block timestamp and difficulty are of interest for estimating the net hash rate. I divided the weighted difficulty (block difficulty * block time) by the mean block time for all blocks on a day to get an estimate of that days net hash rate. There might be other ways to do this but for this application this works. Each day there are between 25.000 and 40.000 new blocks which provides sufficient data to do it this way.
Daily ether to miners
This is the total amount of ether rewarded to all the miners per day. As a miner you can ether in several different ways, see this list below which includes all of the ways to earn ether:
- 5 ether for a block found
- 4.375 to 1.25 with steps of .625 depending where the uncle is included ((U_n + 8 - B_n) * R / 8).
- 0.15625 for a found uncle block (1/32 * 5)
- transactions fees The total ether rewarded to the miners is between 5 and 14 ether, there are some exceptions though. i.e. block number 2770908 which has a total of 766 ether. If you are interested have a look at 30 biggest blockrewards.
The dashboard
The data collection and preparation was done in R as well as the forecasting and visualizations. These however where not production ready yet and needed additional work. Recently I came across shinyapps.io, a relatively simple tool to create well looking dashboards in R and wanted to give it a go. It went quicker then I thought and within no time I had published my calculator/dashboard on shinyapp.io, see Ether mining profitability calculator.
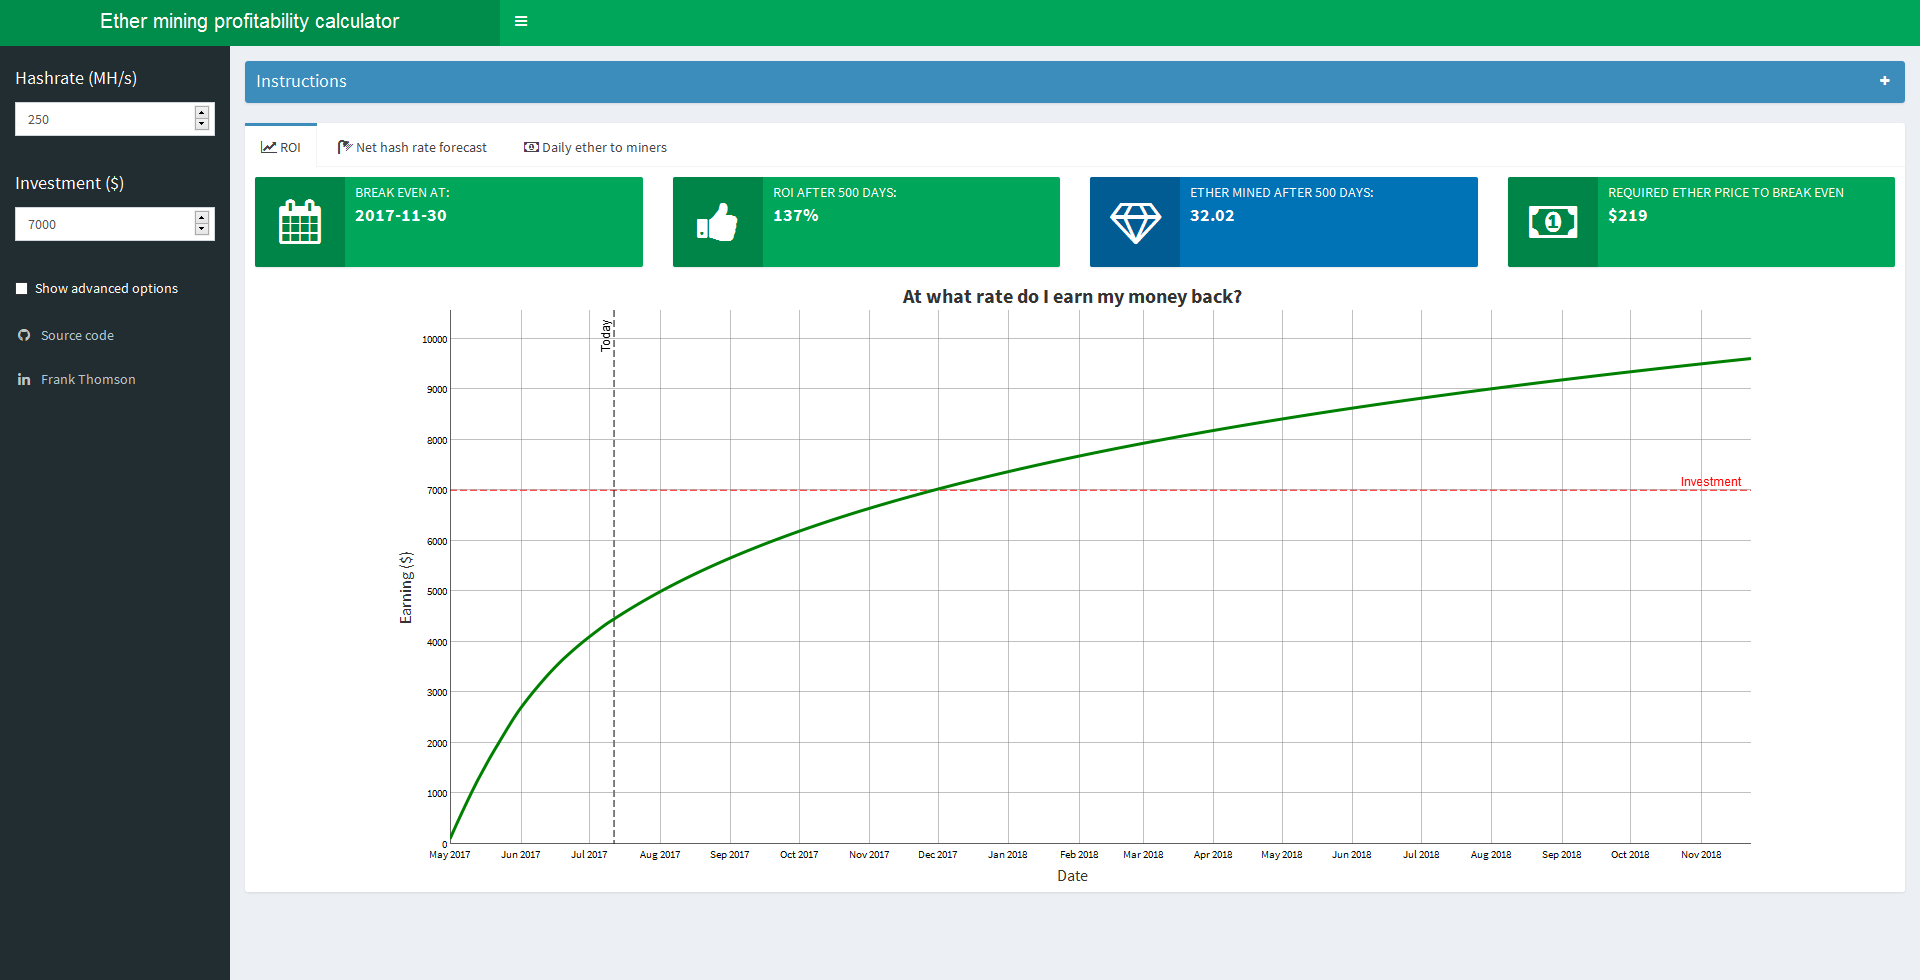
How do I use the calculator/dashboard?
The dashboard is divided in two sections, an input section at the left and tabs with output on the middle/right. In the input section you can enter your hashrate and investment cost. Click on ‘Show advanced options’ to change the days to forecast, date of investment, ether sell price, energy consumption and energy price. If you are a cloud miner you can set the energy price to 0. Based on the values you provided this app calculates the expected ROI and ether mined after the forecasted period. You can use the chart to see your returns at an earlier date. You can zoom in by selecting a specific period in the chart, double clicking resets your zoom.
In the output sections you can see three tabs: ROI, Net hash rate forecast and Daily ether to miners. The ROI (return on invesment) tab shows the rate at which you are earning money. The net hash rate forecast tab show you a forecast of the predicted future hashrate. The daily ether to miners tab show you the predicted amount of ether which is rewarded to the miners.